Share this with your friends


901-465-7172
Real Estate Company
Find Your Place in the Mid-South
Real Estate & Community News

Aug. 15, 2026
Reading an Oakland TN Housing Market Report: August 2026
Posted in
Blog history
no comments yet
July 22, 2026
Priced Out? A Condo or Townhome Could Be Your Way In.
Priced Out? A Condo or Townhome Could Be Your Way In.
Today's home prices have a lot of buyers – especially first-time buyers – wondering if there’s even anything out there that’s in their budget. But owning a home may be more within reach than you think. Sometimes, it just means considering a different type of home.
Condos and townhomes can be a great way to buy without stretching every last dollar. And right now, two things make them worth a serious look.
There Are More Condos and Townhomes To Choose From
Maybe you feel like there’s just nothing out there for you, and you’ve exhausted all your options. But have you considered condos or townhomes? A lot of buyers start by looking for a single-family, detached home without even realizing what that search omits from their pool of choices.
According to HousingWire Data, there were 233,030 condos and townhomes for sale this June. That's more than any June in at least the past decade, and more than double the number available back in 2022 (see graph below):
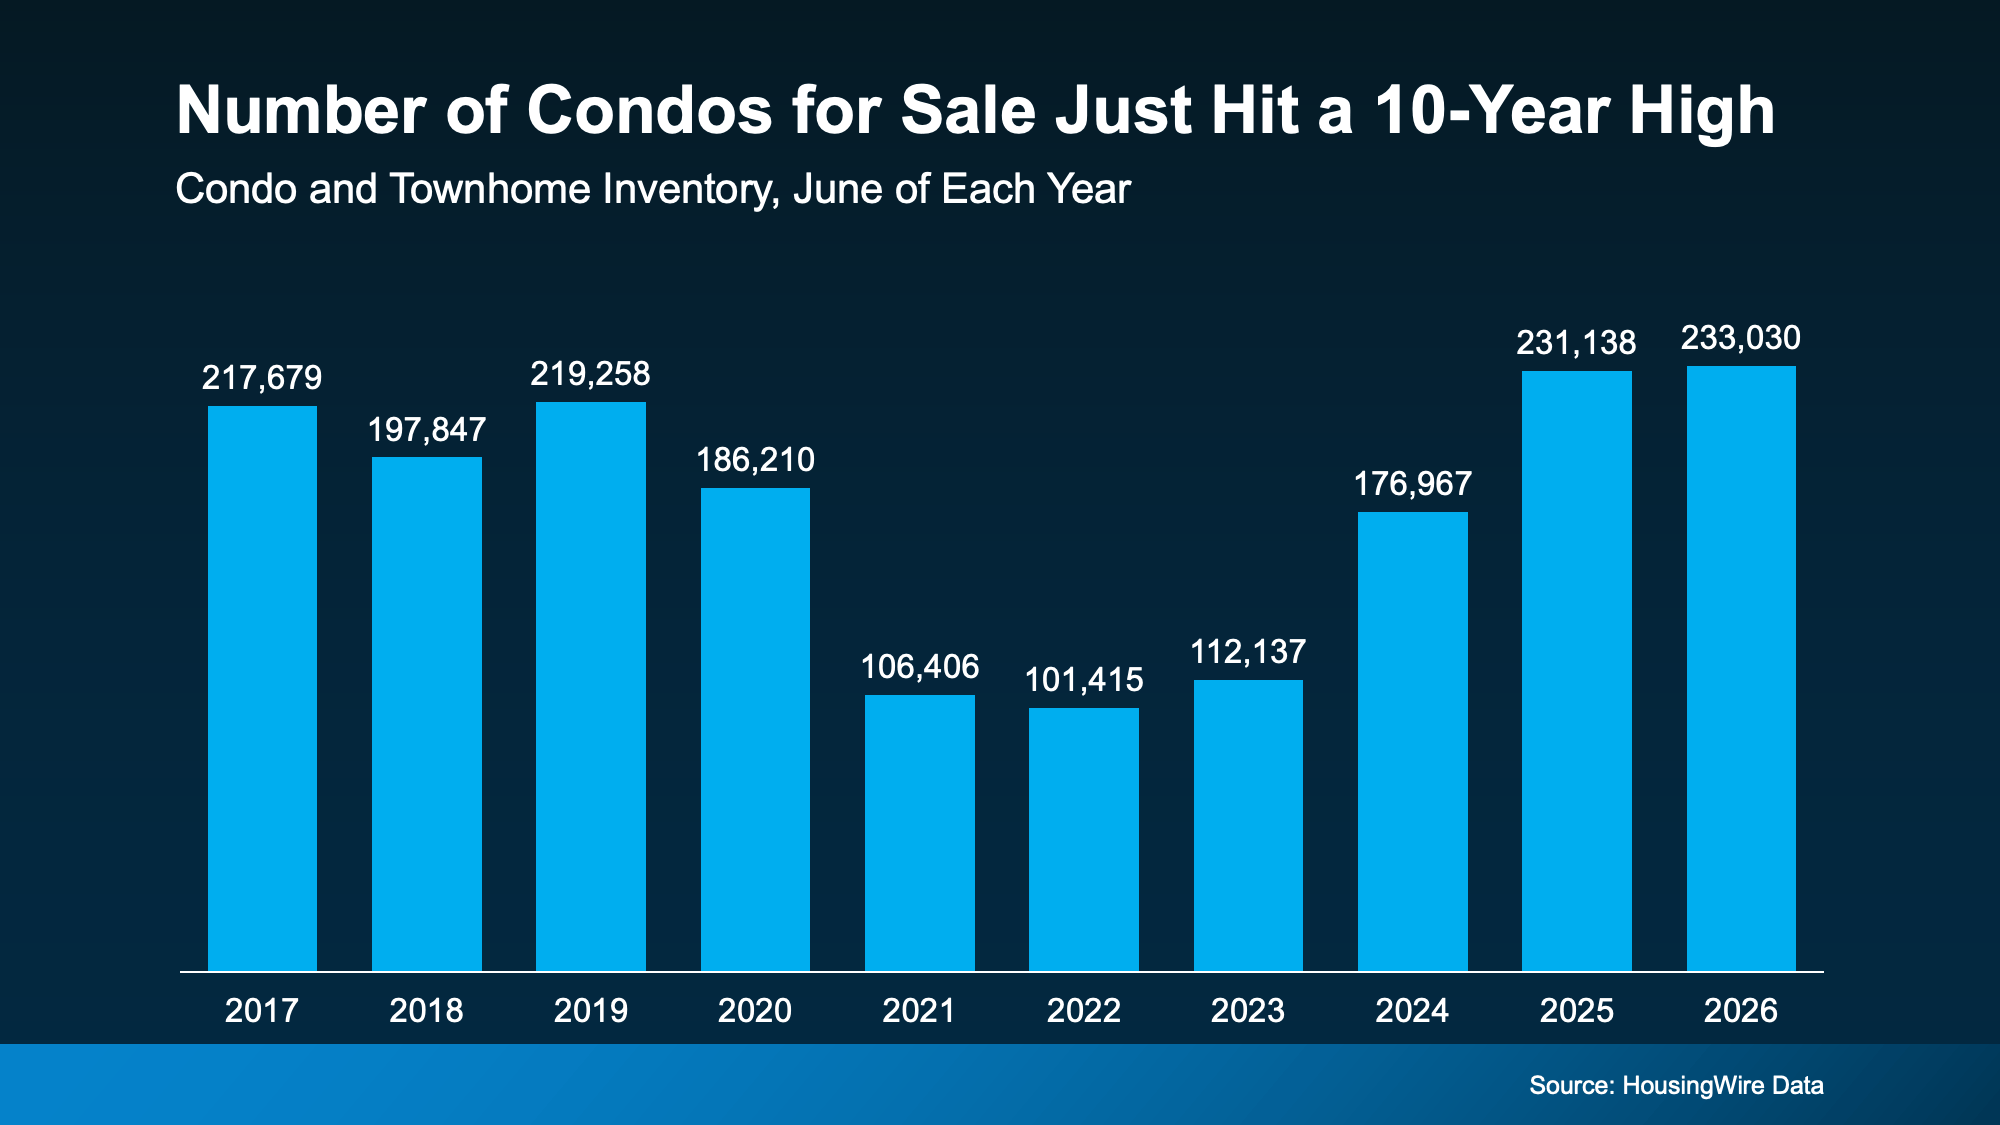
That means there are more options out there in this segment of the market – and that’s especially good news for first-time buyers. These types of homes can be a great way to break into the market for less.
Just remember, that's the national number. What's available will depend on where you're looking. But generally speaking, more options means less competition, more time to decide, and more room to negotiate.
They Also Tend To Cost Less Than Single-Family Homes
Price is the other big draw. According to the National Association of Realtors (NAR), the median condo price was $380,000 in June. In contrast, the median single-family home price was $446,400 (see graph below):
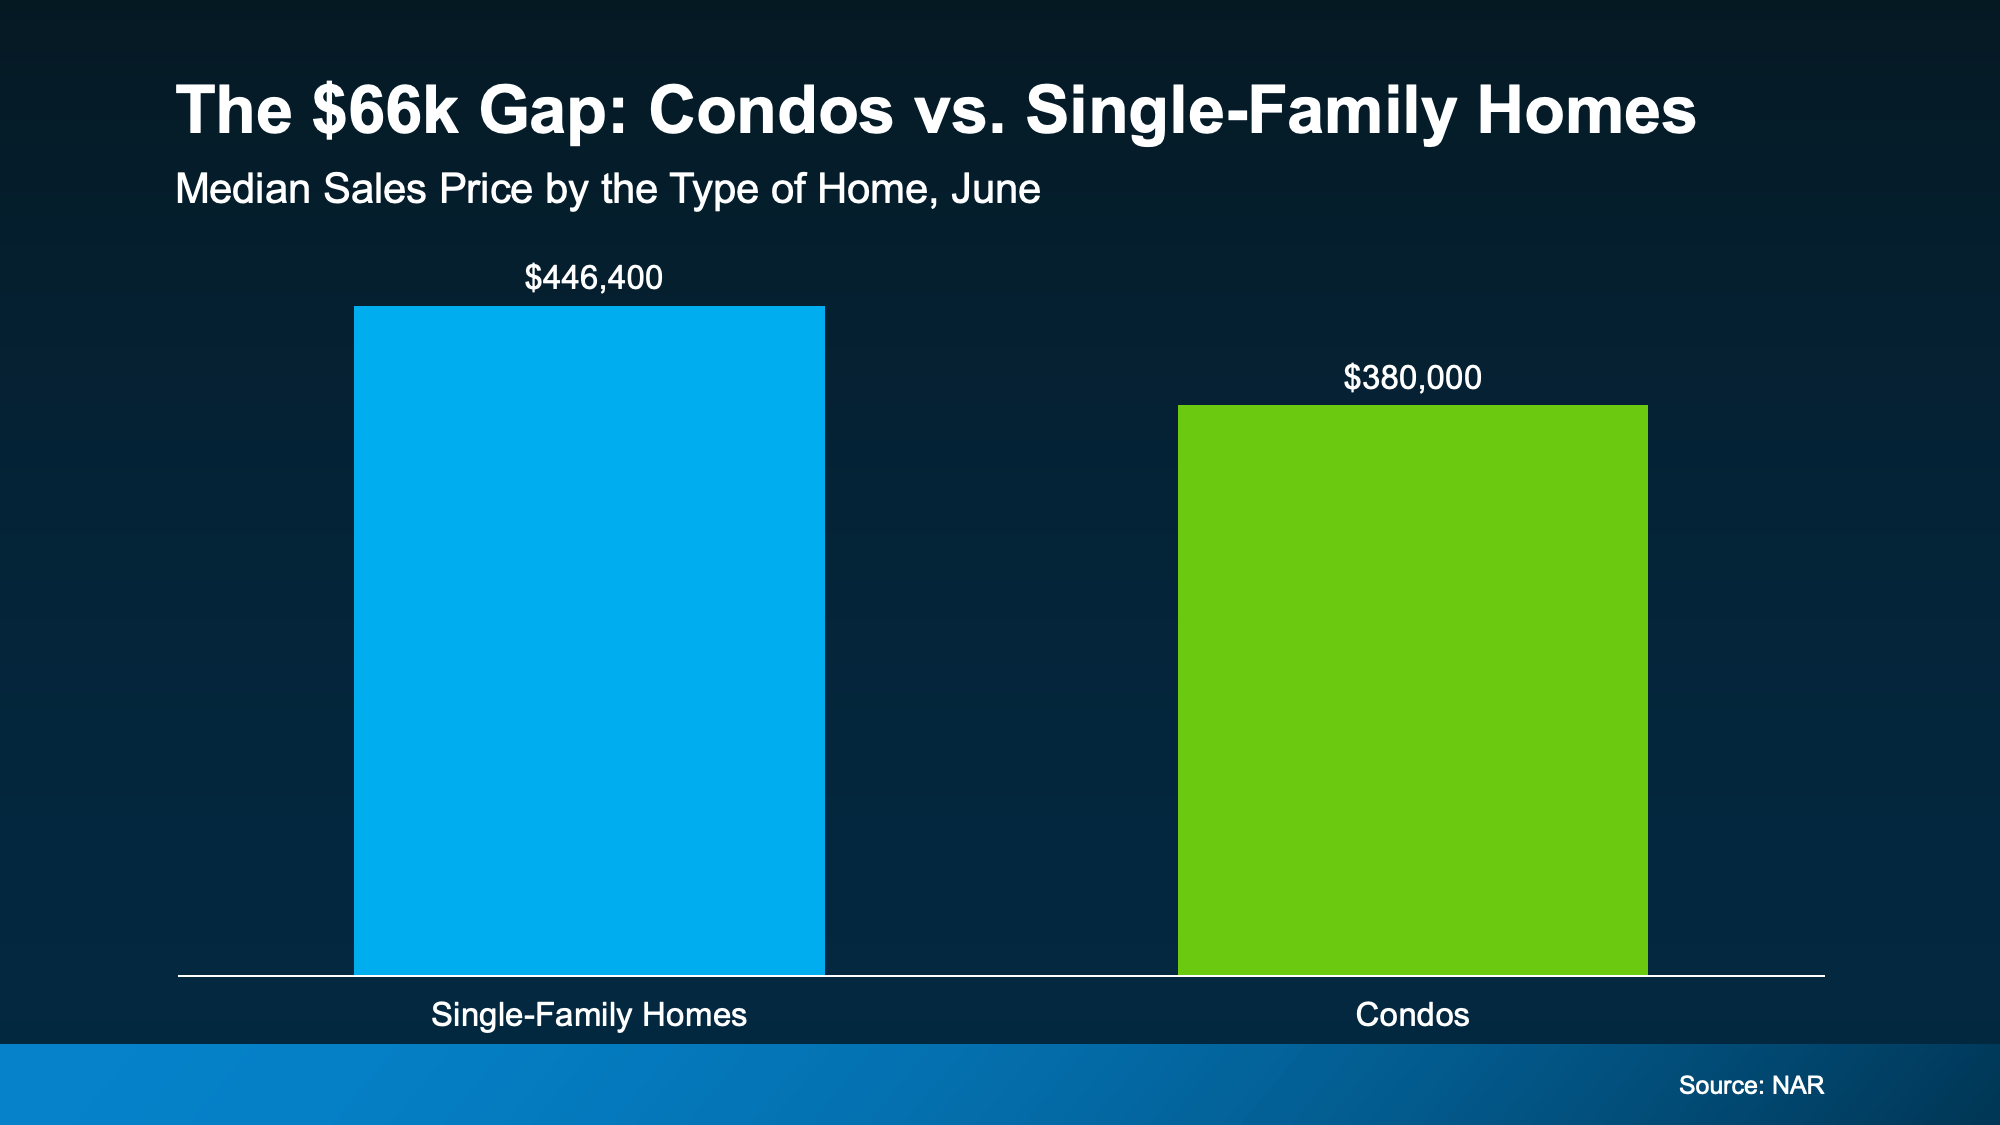
That's a difference of more than $66,000.
A big reason why? Condos are usually smaller than single-family homes. And smaller homes can come with smaller price tags.
And if you don't need all that extra space, that lower entry price could be exactly what gets you through the door.
Condo or Townhome? How They’re Different.
For buyers who feel priced out of the market, a condo or townhome could be a way in. But there are some things to know. Before you start checking out homes, it’s good to understand how these two compare to each other – and to a single-family home.
-
With a single-family detached home, you own the house and the land it sits on, and you don’t share any walls with neighbors. That means the most space and privacy. But it also usually comes with a higher tag, and all the maintenance is on you.
-
With a townhome, you own the building and the lot it sits on. They're usually multi-level, so you get more space, and you share two walls at most. You'll also have more say over how your home looks and how repairs get done, but more of that upkeep falls on you.
-
With a condo, you own just the inside of your unit and may have access to community features like a pool or gym. The building and shared space belong to everyone who lives there, which means you have less maintenance responsibilities. But you’ll also likely have more neighbors around you, less control over building decisions, and higher HOA fees since the HOA handles the exterior and common areas.
Bottom Line
A condo or townhome could be your path to owning a home without blowing your budget. Let’s connect to see what's for sale in our area and figure out which type of home fits your lifestyle, and your bottom line.
July 20, 2026
The Memphis Housing Market: An Eighteen-Year Perspective
Groome & Co. LLC Realtors® · Community Market Education
The Memphis Housing Market: An Eighteen-Year Perspective
Every December MAAR report from 2009 through 2025, plus June 2026 — a plain-English history of sales, prices, inventory, foreclosures, and interest rates, so you can judge today's market against the full record, not just the headlines.
Freely shared with our community • Data: MAAR Home Sales Reports (MAARdata) · Rates: Freddie Mac
The Whole Story in One Table
Memphis Metro, Year by Year
| Year | Home Sales | Median | Average | Dec. Listings | Mos. Supply | Foreclosures | Avg 30-yr Rate |
|---|---|---|---|---|---|---|---|
| 2008 | 17,328 | $99,000 | $134,974 | 10,484 | 7.3 | 6,438 | 6.03% |
| 2009 | 15,186 | $96,500 | $127,803 | 8,771 | 6.9 | 5,415 | 5.04% |
| 2010 | 13,711 | $91,000 | $128,813 | 8,379 | 7.3 | 4,590 | 4.69% |
| 2011 | 12,790 | $85,900 | $125,448 | 7,194 | 6.7 | 4,113 | 4.45% |
| 2012 | 15,071 | $89,000 | $128,774 | 6,481 | 5.2 | 4,575 | 3.66% |
| 2013 | 16,159 | $106,400 | $143,395 | 6,190 | 4.6 | 3,962 | 3.98% |
| 2014 | 15,602 | $120,000 | $152,839 | 6,131 | 4.7 | 3,124 | 4.17% |
| 2015 | 16,347 | $125,000 | $158,945 | 5,793 | 4.3 | 3,175 | 3.85% |
| 2016 | 18,083 | $132,350 | $164,498 | 4,715 | 3.1 | 2,205 | 3.65% |
| 2017 | 19,274 | $139,000 | $173,100 | 4,190 | 2.6 | 1,828 | 3.99% |
| 2018 | 19,734 | $148,000 | $182,465 | 4,050 | 2.5 | 1,413 | 4.54% |
| 2019 | 19,589 | $155,000 | $190,488 | 3,682 | 2.3 | 1,082 | 3.94% |
| 2020 | 19,660 | $177,000 | $214,516 | 2,403 | 1.5 | 477 | 3.10% |
| 2021 | 22,263 | $205,000 | $240,584 | 2,165 | 1.2 | 290 | 2.96% |
| 2022 | 19,872 | $220,000 | $262,518 | 2,934 | 1.8 | 431 | 5.34% |
| 2023 | 15,637 | $215,000 | $267,502 | 3,218 | 2.5 | 383 | 6.81% |
| 2024 | 15,669 | $210,000 | $268,042 | 3,469 | 2.7 | 420 | 6.72% |
| 2025 | 15,047 | $224,250 | $274,658 | 4,078 | 3.3 | 467 | ≈6.6% |
| 2026 (Jan–Jun) | 6,942 | $230,000 | $281,060 | 5,067* | 3.4 | 239 | ≈6.5% |
Figures as reported in each year's own December MAAR report (MAARdata revises historical numbers slightly over time). Months of supply = December listings ÷ average monthly sales. *June 2026 listings — a 24-month high. 2025–26 rates approximate; Freddie Mac's 30-year average was 6.49% the week of July 9, 2026.
Chart I
Sales Volume Follows Interest Rates

Watch the light-blue rate line against the navy sales bars. When money got cheaper (2012–2016, 2020–2021), transactions climbed. When rates doubled in 2022–23, sales fell 30% from peak in two years — the volume response to rates is fast and brutal. But notice 2024–25: sales flattened around 15,000–15,700 even with rates near 7%. That's the market finding its footing at a new normal — roughly the same annual pace as 2012–2014.
Chart II
Prices Are a Different Animal

Here's the chart that should reframe how we all think about "crashes." In eighteen years, the metro median has fallen meaningfully exactly once: 2008–2011, peak-to-trough −13% ($99,000 → $85,900) — and that took a global financial crisis, mass unemployment, and thousands of forced sales. The 2022–23 rate shock, the fastest rate increase in 40 years? The median dipped 2.3%, twice, and resumed climbing. From the 2011 trough to today, the Memphis median is up 168%.
Charts III & IV
The Supply Collapse — and Why Prices Held
December active listings

Annual foreclosure actions

These two charts explain everything. Inventory fell 84% from the 2008 peak (12,113 listings in January 2008) to the 2021 floor. Foreclosures fell 93% — from 6,438 a year to a few hundred. In 2009, bank sales were 38.6% of every transaction in the metro (5,866 of 15,186). In recent years they've run 0.5–1.6%. When rates spiked in 2022 there was no wave of forced sellers to flood the market — so prices never broke. Today's 5,067 listings sound high after 2021, but we're still 52% below the 2008 supply peak.
The Eras
Six Chapters of Local History
The Foreclosure Era 2008–2011
The financial crisis hits. Sales slide four straight years to 12,790 — the lowest in this dataset. Inventory tops 10,000; over a third of sales are bank-owned; the median grinds down 13% to $85,900. Rates fall from 6% to 4.5% and it doesn't matter — cheap money can't fix forced selling and fear. The takeaway: distress, not rates, is what breaks prices.
The Investor Recovery 2012–2015
Sub-4% rates plus the cheapest houses in a generation bring investors — including institutional buyers who make Memphis a national single-family-rental target. Sales jump 18% in 2012 alone. The median leaps 20% in 2013 as the distressed share shrinks. The takeaway: markets recover from the bottom up — often while headlines are still grim.
The Long Expansion 2016–2019
Steady jobs, ~4% rates, and healthy demand push sales near 20,000 a year — the strongest sustained run in the dataset. Prices compound 5–7% annually. Inventory quietly erodes from 4,715 to 3,682 because building never caught up after 2008. The takeaway: the "boring" years did more for household wealth-building than the dramatic ones.
The Pandemic Boom 2020–2021
Rates collapse to 2.96%. Sales hit an 18-year record — 22,263 in 2021 — while inventory hits an all-time floor of 2,165. That's 1.2 months of supply: functionally nothing for sale. The median jumps 28% in two years. The takeaway: 2021 was a once-in-a-generation anomaly built on emergency monetary policy — not a fair baseline for anyone's expectations.
Rate Shock & Lock-In 2022–2025
Rates double in 18 months, the fastest climb since 1981. Volume drops 30% from peak as buyers lose purchasing power and sellers with 3% mortgages refuse to move — the "lock-in effect." But the median barely flinches (−2.3% in '23 and '24, then +6.8% in '25) because supply stays historically scarce and distress stays near record lows. The takeaway: affordability crises freeze markets; they don't crash them, absent forced sellers.
The New Normalization 2026 →
Inventory has rebuilt to 5,067 — a 24-month high, though barely half of 2008 levels. Months of supply: 3.4, up from 1.2 at the trough but well under the 6–7 of the crash years. Rates near 6.5%. Sales stabilizing, prices up 4.5% so far this year. This looks most like 2014–2015: a functioning, negotiable, fundamentals-driven market. If your reference point is 2020–21, today feels slow. If your reference point is 2008–11, today looks remarkably healthy.
The Distillation
Three Patterns Worth Remembering
1. Rates drive volumeEvery major swing in transaction count in 18 years maps to the cost of money. Rates fall → sales rise within 12–18 months; rates spike → volume drops fast. To anticipate how busy the market will be, watch where mortgage rates are heading. |
2. Supply drives pricePrices rose through 7% rates because there was nothing to buy, and fell in 2009 because there was everything to buy. To anticipate what homes are worth, watch months of supply — under roughly 5, sellers hold pricing power; the trend matters more than the level. |
3. Distress drives crashesThe only real price decline required 6,000+ foreclosures a year and 38% bank sales. Homeowner equity today is the firewall. If you're worried about a crash, watch foreclosure filings — at roughly 470 a year versus 6,438 in 2008, the fuel simply isn't there. |
Context for Today
Where June 2026 Sits in Eighteen Years of History
|
3.4
Months of Supply Today
2008: 7.3 · 2021: 1.2 · balanced ≈ 5–6
|
52%
Below 2008 Peak Inventory
5,067 now vs 10,484 then
|
−93%
Foreclosures vs 2008
~470/yr now vs 6,438 then
|
+168%
Median Since 2011 Trough
$85,900 → $230,000
|
The honest translation: today's market is not 2008 (no distress, half the inventory), and it's not 2021 (three times the selection, real negotiating room). It's closest to 2014–15 — a normal market that rewards preparation and punishes mispricing. If you're waiting for either a crash or 3% rates, this dataset suggests you're waiting for a foreclosure wave that doesn't exist — or an emergency the Federal Reserve has no intention of repeating.
The Forecast Framework
Four Dials to Watch — and What They'd Mean
Mortgage rates (now ≈6.5%)History says a sustained move toward 5.5% unlocks meaningful volume — both locked-in sellers and sidelined buyers. Expect listings and sales to rise together, which can actually soften price growth even as activity booms. A move toward 7.5%+ freezes volume further but, absent distress, doesn't break prices. |
Months of supply (now 3.4, rising)The dial that matters most for pricing. 3–4 months: sellers still lead, precision required. Past ~5: expect flat-to-soft prices and longer days on market — sellers do best listing before the neighborhood does. Back under 3: multiple-offer conditions return. |
Foreclosure filings (now ~40/month)The crash early-warning system. Metro filings would need to grow several-fold for a distress cycle — watch for sustained moves past 100+/month paired with rising unemployment. Nothing in the current data suggests it; equity cushions are historic. |
New construction mixBuilders are the swing supplier. Their pivot to attainable product — new-home medians falling while closings rise in Bartlett, Millington, and Fayette County — adds inventory exactly where first-time demand lives: a stabilizer for volume and a ceiling on entry-level price spikes. |
Nothing here is a prediction — it's a framework. No one can tell you where the market will be next year; what history can tell you is which indicator answers which question. Any good agent — ours or otherwise — can pull the current reading for your neighborhood.
GROOME & CO. LLC REALTORS®
Sources: Memphis Area Association of REALTORS® December Home Sales Reports 2009–2025 and June 2026 report (MAARdata — deed recordings, Shelby, Fayette & Tipton Counties, TN; 2008 figures from prior-year comparisons in the 2009 report). Interest rates: Freddie Mac Primary Mortgage Market Survey annual averages; 2025–2026 approximate. Figures as reported at the time; MAAR revises historical data. General market education, not individualized advice.
We publish this freely because an informed community makes better decisions — whether or not you ever work with us. © 2026 Groome & Co. LLC Realtors®. Equal Housing Opportunity.
July 17, 2026
June 2026: What Actually Happened in the Memphis Market
Groome & Co. LLC Realtors® · Community Market Education
June 2026: What Actually Happened in the Memphis Market
A plain-English look at the numbers — no hype, no spin, and what they mean for you.
Freely shared with our community • Data: Memphis Area Association of REALTORS®, June 2026
The Headline Numbers
June 2026 at a Glance
|
1,490
Homes Sold in June
▼ 6.8% vs June 2025 · ▲ 7.6% vs May
|
$260,000
Median Sales Price
▲ 0.4% year-over-year
|
$314,986
Average Sales Price
▲ 4.7% year-over-year
|
49
Avg. Days on Market
▼ 5.8% from May
|
|
5,067
Active Listings
▲ 12.2% YoY — 24-month high
|
3.4
Months of Supply
vs 2.8 a year ago
|
1,563
Pending Sales
A solid July pipeline
|
38
June Foreclosures
▼ 47.9% YoY
|
"Months of supply" = how long it would take to sell every home currently listed at the current sales pace. Under ~5 months generally favors sellers; over ~6 favors buyers. Memphis sits at 3.4 — still seller-leaning, but the most balanced we've been in two years.
The Big Picture
Is the Market Crashing? No — It's Normalizing.
You may have heard that home sales are down. That's true: the Memphis area recorded 6,942 sales in the first half of 2026, about 8% fewer than the same period last year. But here's what the headlines skip — prices rose at the same time. The median sale price climbed 4.5% to $230,000, and nearly $2 billion in homes still changed hands in six months.
In a true downturn, sales and prices fall together. What we have instead is a pickier market: fewer transactions, happening at higher prices, taking a reasonable ~49 days. That's a market returning to normal after several frenzied years — not one falling apart.
| 2026 YTD | 2025 YTD | Change | |
|---|---|---|---|
| Total Home Sales | 6,942 | 7,532 | ▼ 7.8% |
| Median Sales Price | $230,000 | $220,000 | ▲ 4.5% |
| Average Sales Price | $281,060 | $270,052 | ▲ 4.1% |
| Total Sales Volume | $1.95 billion | $2.03 billion | ▼ 3.9% |
| New Home Sales (units) | 339 | 384 | ▼ 11.7% |
| Foreclosure Actions | 239 | 267 | ▼ 10.5% |
One more myth, retiredWaiting for a wave of foreclosures to bring bargains? June foreclosure actions fell 47.9% from last year — just 38 in the entire three-county area. Homeowners today hold record equity. There is no distressed wave coming. |
The Supply Story
Buyers Finally Have Choices

Active listings reached 5,067 in June — the highest level in at least two years, and 12.2% more than last June. For buyers, that means real selection and real negotiating room on terms, repairs, and closing help. For sellers, it means your home now has visible competition — pricing accurately from day one matters more than it has in years. Homes priced to the current market still sell in about 49 days; overpriced homes sit while the neighbors' sell.
Around the Area
How Our Communities Performed in June
| Market | June Sales | YoY | June Median | YoY | YTD Sales | YTD Median |
|---|---|---|---|---|---|---|
| Fayette County | 105 | ▲ 61.5% | $395,040 | ▲ 6.8% | 395 | $376,990 |
| Collierville | 118 | ▲ 3.5% | $510,500 | ▼ 6.8% | 422 | $504,500 |
| Bartlett | 155 | ▼ 7.7% | $282,000 | ▲ 6.4% | 719 | $267,000 |
| Germantown | 85 | ▼ 12.4% | $485,000 | ▲ 8.5% | 346 | $480,250 |
| Millington | 30 | ▼ 11.8% | $273,990 | ▼ 9.3% | 140 | $261,495 |
| Cordova | 83 | ▼ 18.6% | $320,000 | ▼ 2.9% | 399 | $305,000 |
| Lakeland | 35 | ▼ 27.1% | $425,000 | ▼ 4.8% | 139 | $420,000 |
| Arlington | 21 | ▼ 27.6% | $575,000 | ▲ 4.7% | 114 | $462,500 |
A note on reading this honestly: in smaller communities like Arlington (21 June sales) and Lakeland (35), one month is a tiny sample — a few closings either way swings the percentage wildly. Year-to-date columns are the more reliable trend. Arlington, for example, shows −27.6% for June yet its year-to-date sales are exactly flat with prices up 4.3% — a market short on homes to sell, not short on buyers.
Community Highlights
Three Stories Worth Knowing
Fayette County is boomingJune sales jumped 61.5% — and it isn't just new construction. Existing-home sales rose 67%, with the existing median up 22.4% to $391,000. Families are heading east for land, new homes near $408K, and lower taxes. Oakland, Piperton, Rossville, and Somerville are the ones to watch. |
Collierville & GermantownCollierville was the only major suburb to sell more homes than last year (June and YTD), with new builds reaching a $992K median. Germantown sold fewer homes at notably higher prices — median up 8.5%, with custom new builds averaging $1.59M this year. |
Affordability still existsMillington's sales are up 15.7% this year with a $261K median and brand-new homes at $308K. Bartlett remains the metro's steadiest market — 719 sales at a $282K June median. First-time buyers: these are your markets. |
What It Means for You
Practical Guidance, Whichever Side You're On
If you're thinking of selling
|
If you're thinking of buying
|
Every neighborhood is its own market. These are metro-level patterns — the right decision for your street depends on hyper-local data any good agent (ours or otherwise!) can pull for you.
GROOME & CO. LLC REALTORS®
Source: Memphis Area Association of REALTORS® June 2026 Home Sales Report (MAARdata — deed recordings in Shelby, Fayette & Tipton Counties, TN). Percentages compare June 2026 and January–June 2026 to the same 2025 periods.
We publish this report freely because an informed community makes better decisions — whether or not you ever work with us. Share it, question it, and ask us anything about your neighborhood. Boutique, independent, and Memphis-proud.
This report is general market education, not individualized advice. © 2026 Groome & Co. LLC Realtors®. Equal Housing Opportunity.
July 16, 2026
The Memphis Mid-Year Housing Market Report
Groome & Co. LLC Realtors® · Community Market Education
The Memphis Mid-Year
Housing Market Report
A plain-English look at what actually happened in our market through June 2026 — no hype, no spin, just the numbers and what they mean for you.
The Headline Numbers
June 2026 at a Glance
1,490
Homes Sold in June
▼ 6.8% vs June 2025 · ▲ 7.6% vs May
$260,000
Median Sales Price
▲ 0.4% year-over-year
$314,986
Average Sales Price
▲ 4.7% year-over-year
49
Avg. Days on Market
▼ 5.8% from May
5,067
Active Listings
▲ 12.2% YoY — 24-month high
3.4
Months of Supply
vs 2.8 a year ago
1,563
Pending Sales
A solid July pipeline
38
June Foreclosures
▼ 47.9% YoY
"Months of supply" = how long it would take to sell every home currently listed at the current sales pace. Under ~5 months generally favors sellers; over ~6 favors buyers. Memphis sits at 3.4 — still seller-leaning, but the most balanced we've been in two years.
The Big Picture
Is the Market Crashing? No — It's Normalizing.
You may have heard that home sales are down. That's true: the Memphis area recorded 6,942 sales in the first half of 2026, about 8% fewer than the same period last year. But here's what the headlines skip — prices rose at the same time. The median sale price climbed 4.5% to $230,000, and nearly $2 billion in homes still changed hands in six months.
In a true downturn, sales and prices fall together. What we have instead is a pickier market: fewer transactions, happening at higher prices, taking a reasonable ~49 days. That's a market returning to normal after several frenzied years — not one falling apart.
| 2026 YTD | 2025 YTD | Change | |
|---|---|---|---|
| Total Home Sales | 6,942 | 7,532 | ▼ 7.8% |
| Median Sales Price | $230,000 | $220,000 | ▲ 4.5% |
| Average Sales Price | $281,060 | $270,052 | ▲ 4.1% |
| Total Sales Volume | $1.95 billion | $2.03 billion | ▼ 3.9% |
| New Home Sales (units) | 339 | 384 | ▼ 11.7% |
| Foreclosure Actions | 239 | 267 | ▼ 10.5% |
One more myth, retired
Waiting for a wave of foreclosures to bring bargains? June foreclosure actions fell 47.9% from last year — just 38 in the entire three-county area. Homeowners today hold record equity. There is no distressed wave coming.
The Supply Story
Buyers Finally Have Choices
3,5004,0004,5005,0005,067 — 24-month highJul-24SepNovJan-25MarMayJul-25SepNovJan-26MarMayJun-26
Active listings reached 5,067 in June — the highest level in at least two years, and 12.2% more than last June. For buyers, that means real selection and real negotiating room on terms, repairs, and closing help. For sellers, it means your home now has visible competition — pricing accurately from day one matters more than it has in years. Homes priced to the current market still sell in about 49 days; overpriced homes sit while the neighbors' sell.
Around the Area
How Our Communities Performed in June
| Market | June Sales | YoY | June Median | YoY | YTD Sales | YTD Median |
|---|---|---|---|---|---|---|
| Fayette County | 105 | ▲ 61.5% | $395,040 | ▲ 6.8% | 395 | $376,990 |
| Collierville | 118 | ▲ 3.5% | $510,500 | ▼ 6.8% | 422 | $504,500 |
| Bartlett | 155 | ▼ 7.7% | $282,000 | ▲ 6.4% | 719 | $267,000 |
| Germantown | 85 | ▼ 12.4% | $485,000 | ▲ 8.5% | 346 | $480,250 |
| Millington | 30 | ▼ 11.8% | $273,990 | ▼ 9.3% | 140 | $261,495 |
| Cordova | 83 | ▼ 18.6% | $320,000 | ▼ 2.9% | 399 | $305,000 |
| Lakeland | 35 | ▼ 27.1% | $425,000 | ▼ 4.8% | 139 | $420,000 |
| Arlington | 21 | ▼ 27.6% | $575,000 | ▲ 4.7% | 114 | $462,500 |
A note on reading this honestly: in smaller communities like Arlington (21 June sales) and Lakeland (35), one month is a tiny sample — a few closings either way swings the percentage wildly. Year-to-date columns are the more reliable trend. Arlington, for example, shows −27.6% for June yet its year-to-date sales are exactly flat with prices up 4.3% — a market short on homes to sell, not short on buyers.
Community Highlights
Three Stories Worth Knowing
Fayette County is booming
June sales jumped 61.5% — and it isn't just new construction. Sales of existing homes rose 67%, with the existing-home median up 22.4% to $391,000. Families are heading east for land, new homes near $408K, and lower taxes. Oakland, Piperton, Rossville, and Somerville are the ones to watch.
Collierville & Germantown: two kinds of strength
Collierville was the only major suburb to sell more homes than last year (June and YTD), with new builds reaching a $992K median. Germantown sold fewer homes at notably higher prices — median up 8.5%, with custom new builds averaging $1.59M this year.
Affordability still exists
Millington's sales are up 15.7% this year with a $261K median and brand-new homes at $308K. Bartlett remains the metro's steadiest market — 719 sales, nearly identical to last year, at a $282K June median. First-time buyers: these are your markets.
What It Means for You
Practical Guidance, Whichever Side You're On
If you're thinking of selling
- Values are still rising — the metro median is up 4.5% this year. Prepared sellers are doing well.
- You have more competition than any month in two years. The first two weeks on market matter most.
- Price to today's comparable sales, not your neighbor's 2024 result. Accurate pricing is what produces the ~49-day sale.
- Presentation counts again: condition, photos, and readiness separate homes that move from homes that sit.
If you're thinking of buying
- Selection is the best it's been in two years — 12% more homes to choose from than last June.
- Use that leverage on terms: inspections, repairs, closing costs, rate buydowns — not on hoping prices collapse.
- Prices rose while buyers waited: +4.5% metro-wide this year, +22% for existing homes in Fayette County.
- New construction is friendlier than you think — builders are deliberately delivering smaller, more attainable homes, which is why new-home medians came down even as values held.
Every neighborhood is its own market. These are metro-level patterns — the right decision for your street depends on hyper-local data any good agent (ours or otherwise!) can pull for you.