Real Estate & Community News 


Sept. 16, 2026

The Best Time To Buy a Home in 2026 Is Almost Here

The Best Time To Buy a Home in 2026 Is Almost Here


Want to buy a house this year, but not sure if the timing’s right? Seasonally, it may actually be a better time to buy than you expect.

Yes, mortgage rates have been ticking up lately – and that’s creating some real challenges with affordability. No one’s arguing that. But there are also predictable trends that happen this time every year that can put some wind back in your sails.

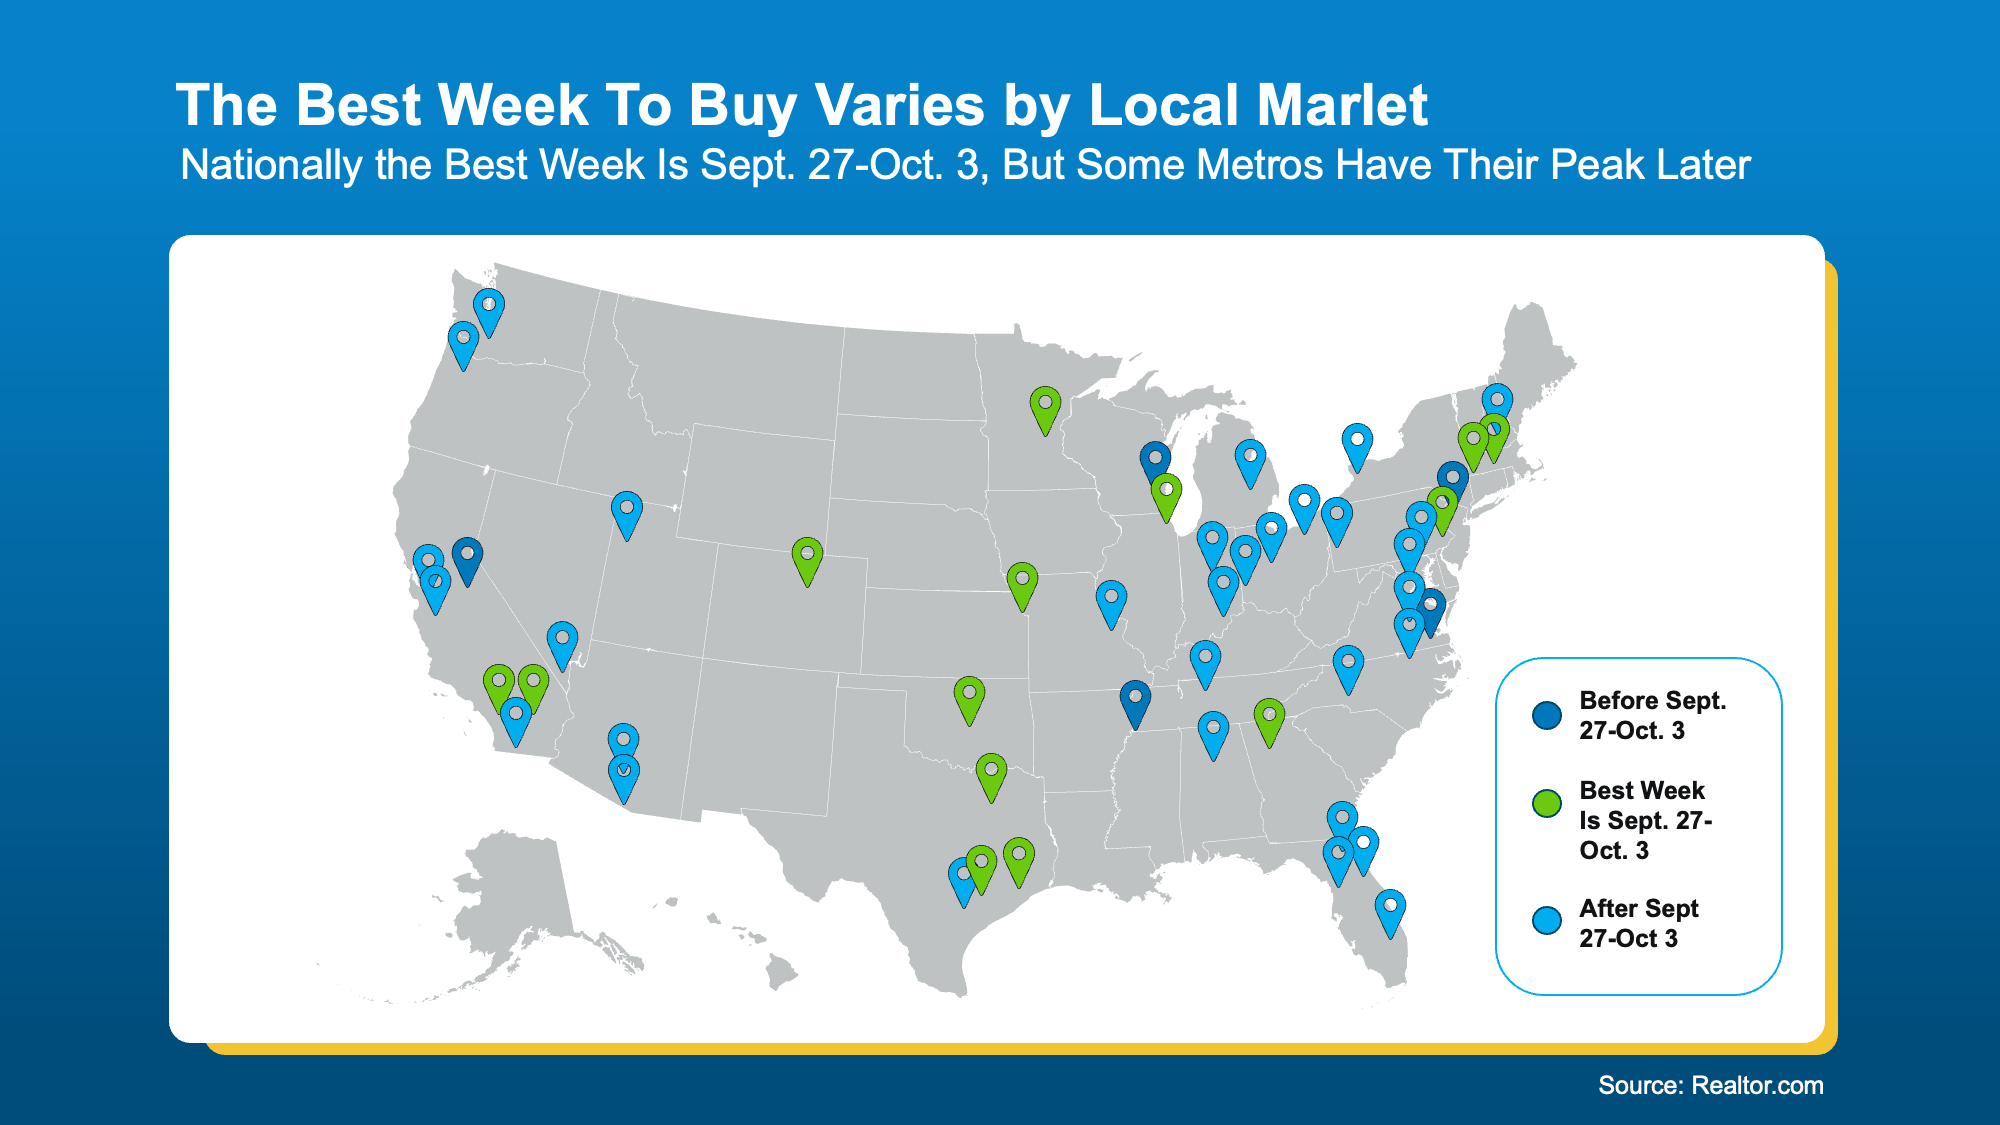
According to research coming out of Realtor.com, nationally, the week of September 27 – October 3 will be the best time to buy this year for this very reason:

“The week of September 27–October 3 brings together the market conditions buyers value most—elevated inventory, less competition and prices that have eased from their seasonal high—giving prepared buyers a way to offset high rates with savings on price and room to negotiate with confidence."

But that’s the national best week. Depending on where you live, your local sweet spot may come a little earlier or later (see map below):

a map of the united states with pins

It all depends on local trends and how inventory and buyer demand ebbs and flows seasonally where you want to live. But no matter when your market hits its peak, here are some of the perks you can expect this time of year.

More Choices, Better Prices, and Less Competition

For starters, there are more homes to choose from. In fact, data from the National Association of Realtors (NAR) shows the number of homes for sale recently reached its highest level in more than 10 years:

“NAR’s data does show a strong uptick in for-sale inventory at the end of the summer, reaching the highest level in more than 10 years.”

That means you may have a better shot at finding something you love and can afford without making as many compromises. And that’s not the only advantage.

Realtor.com says buyers during this window could see home prices about $14,000 lower than the summer peak, along with 30% less competition from other buyers. Plus, homes tend to stay on the market almost 2 weeks longer (13 days), giving you a little more breathing room to make a decision. 

  • More choices.

  • Better pricing.

  • Less competition.

That combination could be enough to ease some of the pressure higher mortgage rates are putting on your budget.

The Window Doesn’t Close After This One Week

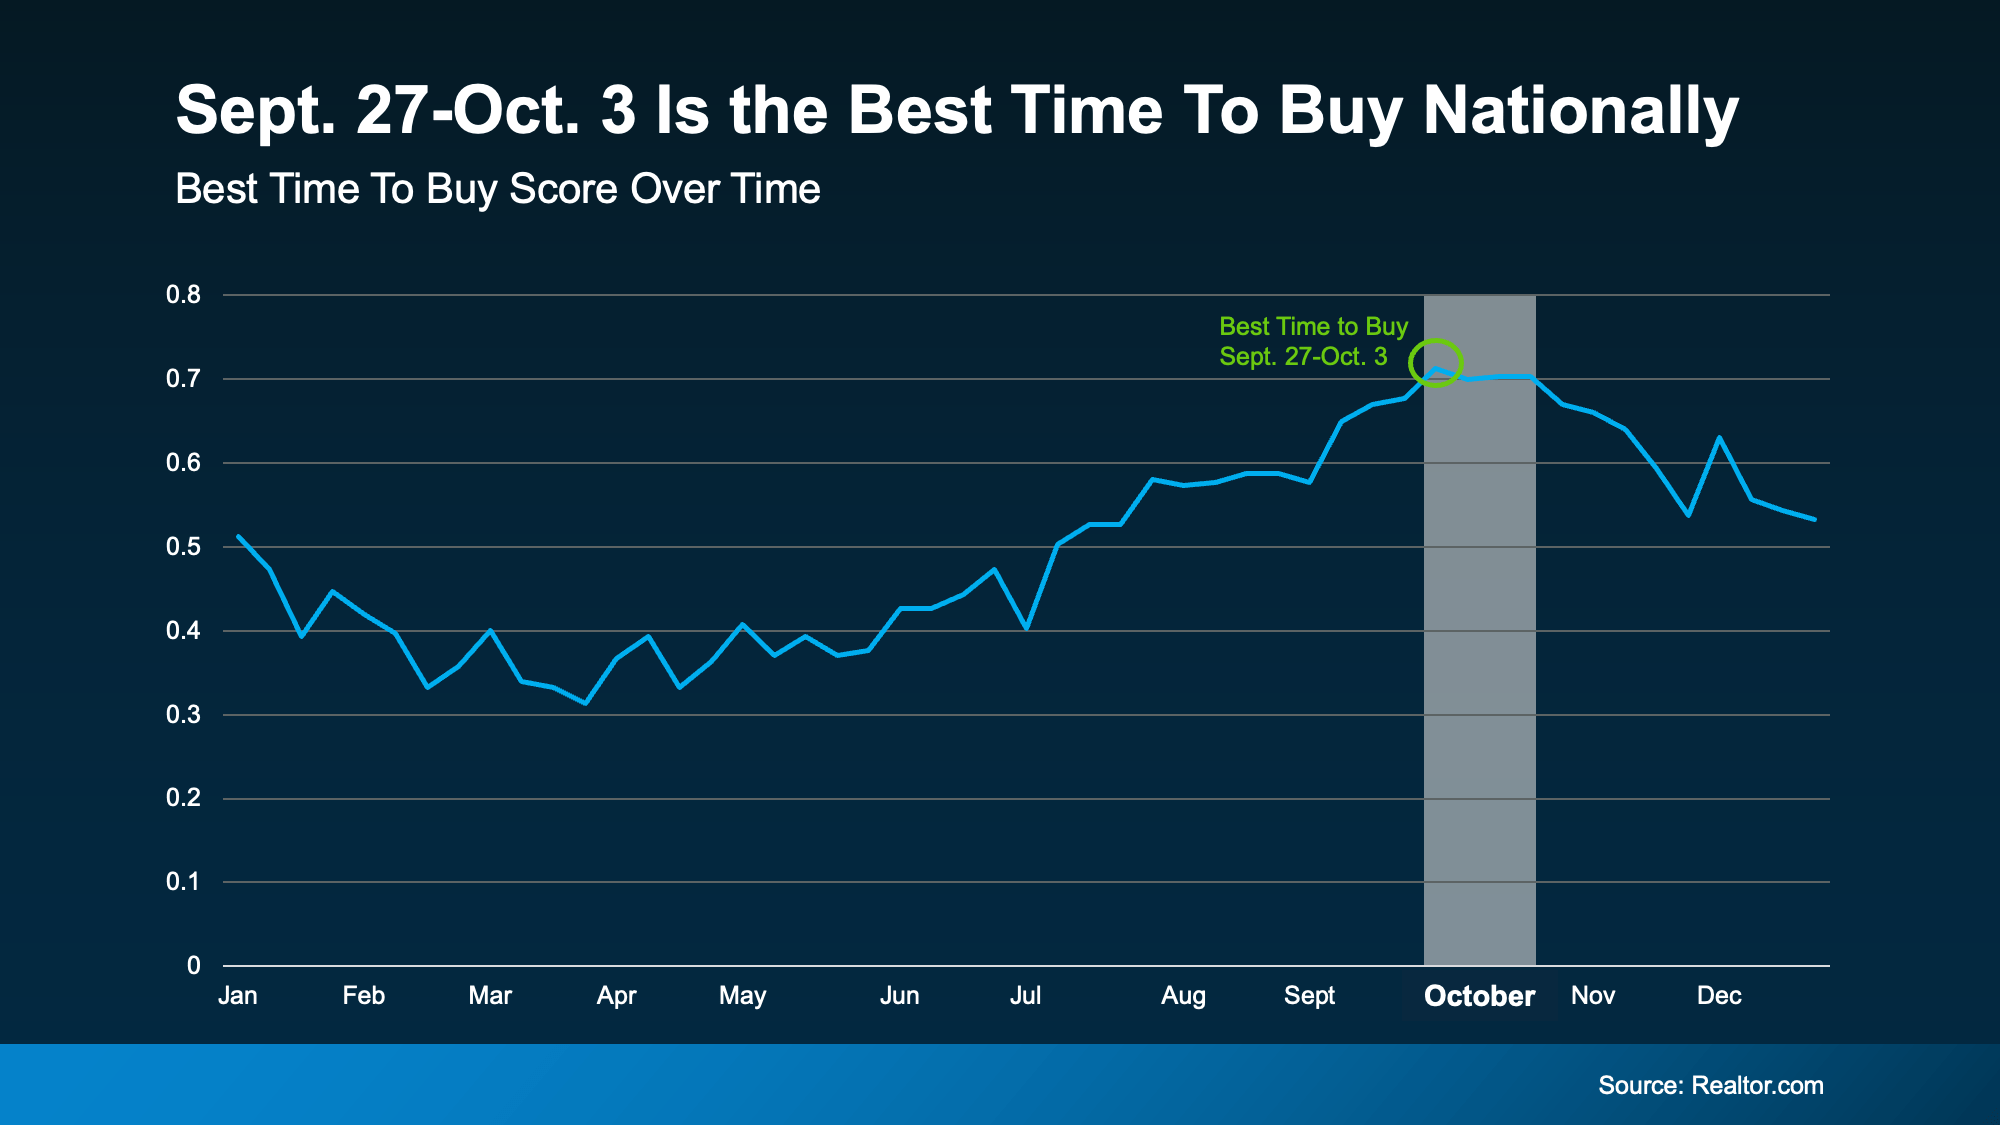
But you certainly don’t have to buy during that very specific window. This isn’t a one-week-only opportunity. History tells us conditions should be tipped in your favor for the entire month of October:

a graph on a dark background

In fact, Realtor.com says 42 of the 50 largest metros see their best week to buy fall sometime during October. So, don’t feel like you have to rush to hit one specific date. Use the time now to get things lined up, then jump in when the timing is right for you. As Guaranteed Rate explains: 

“The best time to buy a home depends on your needs. Certain seasons can give you an advantage when starting your homebuying journey.”

Bottom Line

If you want to buy a house this year, there’s still a way to make it happen, even with today’s rates. This fall gives you the chance to get some of the best seasonal perks the market has to offer.

Want help figuring out when those advantages typically show up in our market?

Let's have a quick conversation about how our market works and the steps you’ll need to take to get ready. 

Sept. 14, 2026

Selling This Fall? You Haven't Missed Your Window

Selling This Fall? You Haven't Missed Your Window


Summer's winding down, and if you've been thinking about selling, you might be wondering if you missed your chance. Better to wait until next year or even next spring, right?

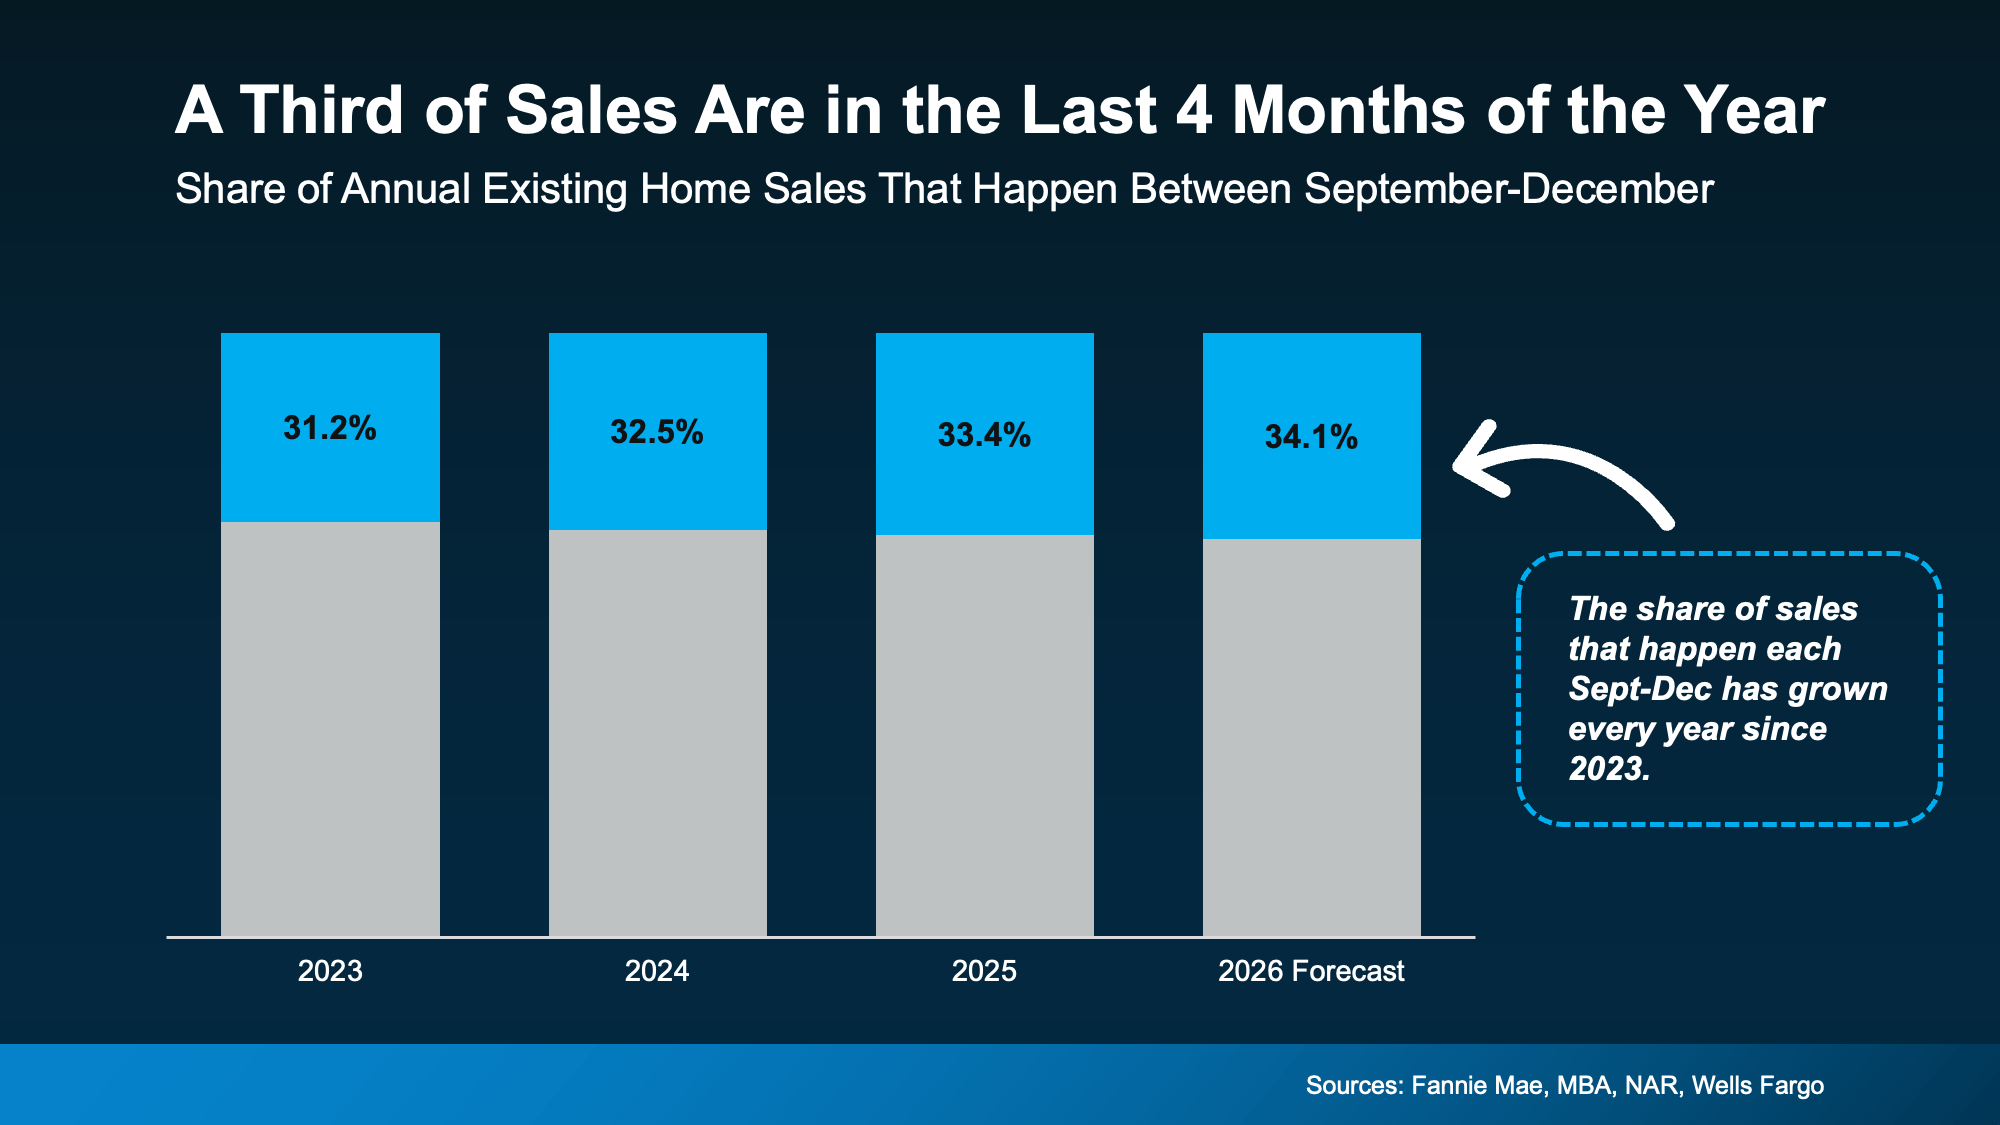
Not so fast. About one in three of all home sales happen in the last four months of the year.

Fall Is Busier than You Think

Data from the National Association of Realtors (NAR) shows around a third of existing home sales happen in the final four months of the year. And that share has grown every year since 2023 (see graph below):

a graph of sales

Here's What That Means for You

According to forecasts from Fannie Mae, the Mortgage Bankers Association (MBA), NAR, and Wells Fargo, there will be about 4.16 million existing home sales this year. Based on how many sales have happened so far, that means roughly 1.4 million sales are expected between now and December.

That's about 11,800 houses selling every single day this fall.

So, the market isn't frozen and you don’t need to put your plans on ice either. Yes, higher rates are keeping some buyers on the sidelines. But hold out for next spring, and you'll sit out months when other serious buyers are ready to move before the new year.

How do you get in front of those buyers who are still out there looking right now? Getting your house sold this season comes down to how well it's priced and presented,  and that's where a local agent shines.

A good agent knows what buyers in your area want right now, prices your house to match this fall's market, and positions it to stand out to the serious buyers shopping before year-end. From the first photo to the final offer, they handle the details that turn your house on the market into one of the 11,800 selling every day.

Bottom Line

Listing this fall doesn't mean your house will sit on the market until spring. Buyers are out there right now, ready to make a move before the new year – and your window is still open.

Let's connect and make yours one of the homes that sells this season.

Sept. 12, 2026

Lakeland TN Fall Home Inventory: Your Negotiating Room

Posted in Buying a Home
Sept. 11, 2026

Arlington TN Fall Rate Swings and the Buyer Demand Shift

Posted in Real Estate News
Sept. 10, 2026

From 10 Months of Inventory to 4: What 19 Years of MAAR Data Tell Us About Today's Market

From 10 Months of Inventory to 4: What 19 Years of MAAR Data Tell Us About Today's Market

Every buyer who calls Groome & Co. Realtors worried about "waiting for prices to crash," and every seller who calls us worried about "missing 2021," is really asking the same question: how does today compare to what's come before?

It's a question our team is uniquely equipped to answer — because many of our seasoned Groome & Co. Realtors, including our own brokers, were active, licensed agents working Memphis deals through every chapter of this story. They didn't read about the 2008 crash in a headline; they were writing offers on short sales in Frayser and watching listings pile up in Cordova. They didn't hear about the recovery secondhand; they watched the bank-sale percentage finally start dropping, deal by deal, client by client. That lived experience — not just a spreadsheet — is what lets Groome & Co. Realtors advise clients with real perspective instead of guesswork, in any kind of market.

To put some numbers behind that perspective, we pulled the actual MAAR sales reports — not estimates, not national headlines, but Shelby/Fayette/Tipton county data — spanning eight snapshots from August 2007 through August 2026. The story they tell is more interesting than "boom" or "bust." It's a fall into the deepest hole in the market's modern history, a long and occasionally uneven climb back out, a decade of steady tightening, and now a real question about where things head next.


Eight Snapshots, 19 Years

August 2007: 13,387 active listings, 2,054 monthly sales, 6.5 months of supply

January 2009: 10,306 active listings, 968 monthly sales, 10.6 months of supply, 7.07 sellers per buyer

December 2011: 7,194 active listings, 898 monthly sales, 8.0 months of supply, 5.22 sellers per buyer

January 2013: 6,070 active listings, 1,259 monthly sales, 4.8 months of supply, 4.04 sellers per buyer

December 2015: 5,793 active listings, 1,367 monthly sales, 4.2 months of supply, 4.10 sellers per buyer

December 2016: 4,715 active listings, 1,487 monthly sales, 3.2 months of supply, 2.99 sellers per buyer

December 2019: 3,682 active listings, 1,617 monthly sales, 2.3 months of supply, 3.26 sellers per buyer

August 2026: 5,056 active listings, 1,254 monthly sales, 4.0 months of supply, 3.48 sellers per buyer

Two ways to read "sellers vs. buyers" here, and both tell the same story. Months of supply (active listings divided by that month's closed sales) is the classic absorption-rate measure. Listings per pending buyer (active listings divided by homes already under contract) is a sharper snapshot of who's actually competing for whom, right now.


The Crash No One at Groome & Co. Who Lived Through It Forgets

August 2007 already looks soft in hindsight — 13,387 homes on the market, the highest inventory point in this entire dataset — but sales were still holding at over 2,000 a month. Memphis hadn't cracked yet. Agents who are with Groome & Co. Realtors today were out there showing houses in a market that still felt, on the surface, fairly normal.

By January 2009, it wasn't normal anymore. Sales had collapsed to 968 units — less than half of August 2007's pace — while listings, though down from their peak, were still sitting at 10,306. That combination produced 10.6 months of supply and roughly 7 sellers for every buyer under contract, the worst imbalance in our dataset. More than half of everything that did sell that month (515 of 968 units, 53%) was a bank or REO sale. Foreclosure filings in Frayser and Raleigh alone topped 300 and 260 respectively in just the first half of 2008. This is the market our veteran agents and brokers cut their teeth negotiating — short sales, REO closings, appraisal gaps, buyers who'd disappear overnight when a bank pulled financing. It's not theoretical for us.

That's what a genuine housing crash looks like in the data: not just more listings, but demand falling off a cliff at the same time.


The Long, Uneven Climb Back

December 2011 still wasn't healthy — 8.0 months of supply, a 5.22-to-1 seller surplus — but the direction had changed. Listings had fallen from over 9,000 to 7,194. Foreclosure actions, while still elevated, were no longer accelerating.

January 2013 is where the recovery becomes undeniable, at least at first glance. Sales jumped 46% year-over-year (1,259 vs. 862 in January 2012) — the single steepest jump anywhere in this dataset — while inventory kept draining, down to 6,070. Bank sales were still 25% of the market, but non-bank sales more than doubled year-over-year, which is the real tell: buyers were coming back on their own, not just mopping up foreclosures.

But the recovery wasn't a straight line. By December 2015, listings had actually crept back up to 5,793 and the seller-surplus ratio (4.10 to 1) was essentially flat versus January 2013 (4.04 to 1) — a genuine plateau, not continued improvement. Bank sales were still 12.4% of the market that December, a reminder that the distressed-inventory hangover took years, not months, to fully clear. It's the kind of pause that can rattle an inexperienced eye into thinking the recovery stalled out. Groome & Co. Realtors who'd already lived through 2009 knew better — they'd seen enough cycles to read a plateau as a pause, not a reversal.

They were right. By December 2016, the real acceleration kicked in: listings fell sharply to 4,715, bank sales dropped to just 7.9% of the market, and year-to-date sales were up 10% on genuinely organic demand. The tightening continued almost without interruption from there, bottoming at a remarkably lean 3,682 listings and just 2.3 months of supply by December 2019 — the tightest, most seller-favorable market in our entire 19-year dataset, tighter even than what we're seeing today.


Where We Are Now

August 2026: 5,056 active listings, 1,254 monthly sales, 4.0 months of supply, and roughly 3.5 sellers for every buyer already under contract. That's a real seller-side edge, but it's nowhere near crisis territory — every measure here shows less seller surplus than the entire 2007–2013 stretch. It's also, notably, looser than the ultra-tight conditions of December 2019, which reframes the real story: the past two years have marked a genuine reversal of the decade-long tightening trend that ran from 2011 all the way through 2019.

Inventory has been climbing steadily since bottoming around 4,000 units in late 2024 and early 2025, up to a 5,192 peak in July 2026 before easing slightly. Meanwhile sales are down 6.6% year-over-year and 8% month-over-month even as prices keep rising (median up 5.9%, average up 11.3% year-over-year). That's an unusual pairing — falling volume, rising price — and it's the opposite pattern from what preceded the 2008 crash, where falling volume eventually dragged prices down with it. Worth watching, not worth panicking over. Bank sales ticked up 42.7% year-to-date, but they're still just 1.3% of the market — a rounding error next to 2009's 53%.

This is exactly the kind of nuance that's easy to miss if you haven't watched a full cycle play out. It's second nature to the Groome & Co. Realtors who have.


The Takeaway

If you're a buyer hoping for 2009-style leverage, the math says it isn't here — you'd need roughly double today's inventory-to-sales ratio to get there, and that kind of imbalance has historically required a demand collapse, not just a supply increase.

If you're a seller worried this looks like the start of something ugly, the closest comparisons in 19 years of data are the recovery years — a market drifting back toward balance after an unusually tight stretch, not a market in decline.

And if the last two decades teach anything, it's that recoveries plateau, tight markets loosen, and reading the difference between a pause and a reversal takes more than one data point — it takes having watched it happen before. That's exactly what Groome & Co. Realtors bring to every client conversation: not just this table, but the team who lived every row of it.


---------------------------------------------------------------------------------------------------------------

Sources: Memphis Area Association of REALTORS® (MAAR) Home Sales Reports, August 2007–August 2026, Shelby/Fayette/Tipton counties. Nothing here is investment advice — every market and every property is different, and Groome & Co. Realtors is always happy to run the numbers for your specific situation.


Sept. 8, 2026

Remote Work Could Be Your Affordability Answer

Remote Work Could Be Your Affordability Answer


For most first-time buyers, the hardest part of buying a home is making the numbers work. You budget, you save, and the finish line still feels far away. 

But your salary is only half the equation. Where you live shapes what you can afford just as much. And if you can work remotely, you have an advantage a lot of buyers don't. 

You're not tied to living where the jobs are, so you can look where your money goes further.

Where You Work Doesn’t Have To Dictate Where You Live

Remote job openings are on the rise. According to FlexJobs, remote job postings climbed 22% from the quarter before. That’s the second quarter in a row of double-digit growth. 

More remote roles mean more people can choose a home base around the life they want to build. As Forbes puts it: 

“Remote employees, freelancers, consultants, entrepreneurs, and business owners have the flexibility to choose a home base based on the life they want to build, whether that means more space, a lower cost of living, better access to nature, or simply somewhere new."

And you can use that freedom to look somewhere more affordable.

Your Paycheck Goes Much Further in Some States

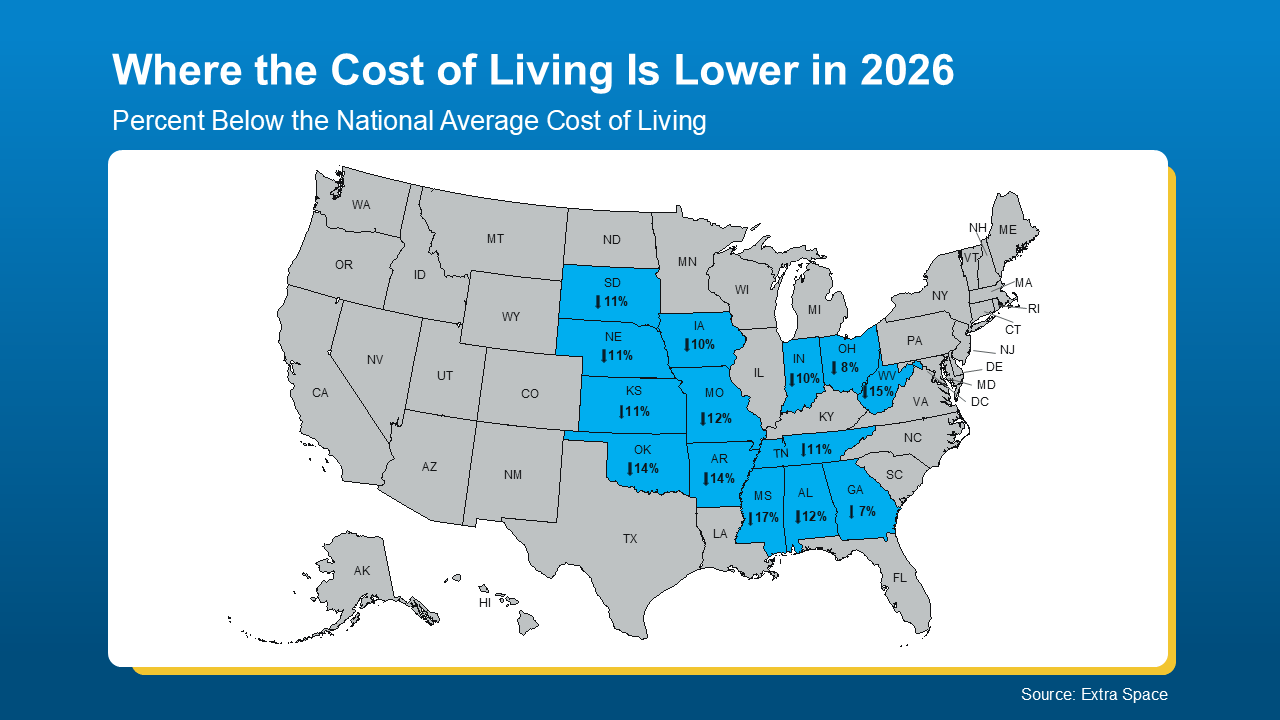
Your cost of living – what you spend on housing, groceries, utilities, and the rest of daily life – varies a lot from one state to the next. In some, according to data from Extra Space, it runs far enough below the national average to change what you can afford (see map below):

a map of the united statesTake Mississippi, for example, where the cost of living sits about 17% below average, or West Virginia at roughly 15% below. When day-to-day life costs less, you can put more of your income toward your goals, homeownership included. Relocate Right describes it this way: 

"Remote work has fundamentally changed the calculus of where to live. When your employer is in San Francisco, but you can work from anywhere, the question is no longer 'where are the jobs' but 'where does my salary go furthest and what kind of life can I build.'"

For a first-time buyer, working remotely could be a chance to put down roots and finally buy. Because with that kind of flexibility, you get to choose where to live and which places work best for your life and goals. 

What To Weigh Before You Go

A lower cost of living is a great start. But it’s also important to consider the things a budget spreadsheet won't show you, because a place can look like a great fit on paper and still not feel like home. 

  • Is the internet fast and steady enough to do your job without interruptions? 

  • Will it be easy to make friends and settle into a routine once you arrive?

  • Does it have the amenities you want, like public transportation or decent takeout?

This is where a local real estate agent comes in. They can help you weigh a big move against a nearby one, because every state has more affordable pockets. Sometimes they’re closer than you think.

An agent will know which neighborhoods fit your budget and have the features you're after, whether that’s walkability, good restaurants, parks, or a nearby farmer’s market. 

Bottom Line

With remote work, where you live can be your decision instead of your employer's. And that puts more affordable places within reach.

Want to explore where that could take you? Let's connect.

Sept. 6, 2026

Bartlett TN Vacation Home Market 2026: 7 Honest Reads

Posted in Blog history
Sept. 4, 2026

Bartlett TN Home Price Trends Heading Into September 2026

Posted in Blog history
Sept. 2, 2026

Worried About a Housing Crash? The Numbers Tell a Calmer Story.

Worried About a Housing Crash? The Numbers Tell a Calmer Story.


A recent survey from Talker Research asked Americans to pick one word to describe how 2026 has felt so far. The winner? Stressful. And honestly, there’s been a lot going on.

So, it’s understandable if you've been putting off buying or selling a home until things settle down. But you may be waiting on something that's already happened. While everything else has felt shaky, the housing market has become one of the steadiest things out there. Look at the data.

Home Prices Have Leveled Out

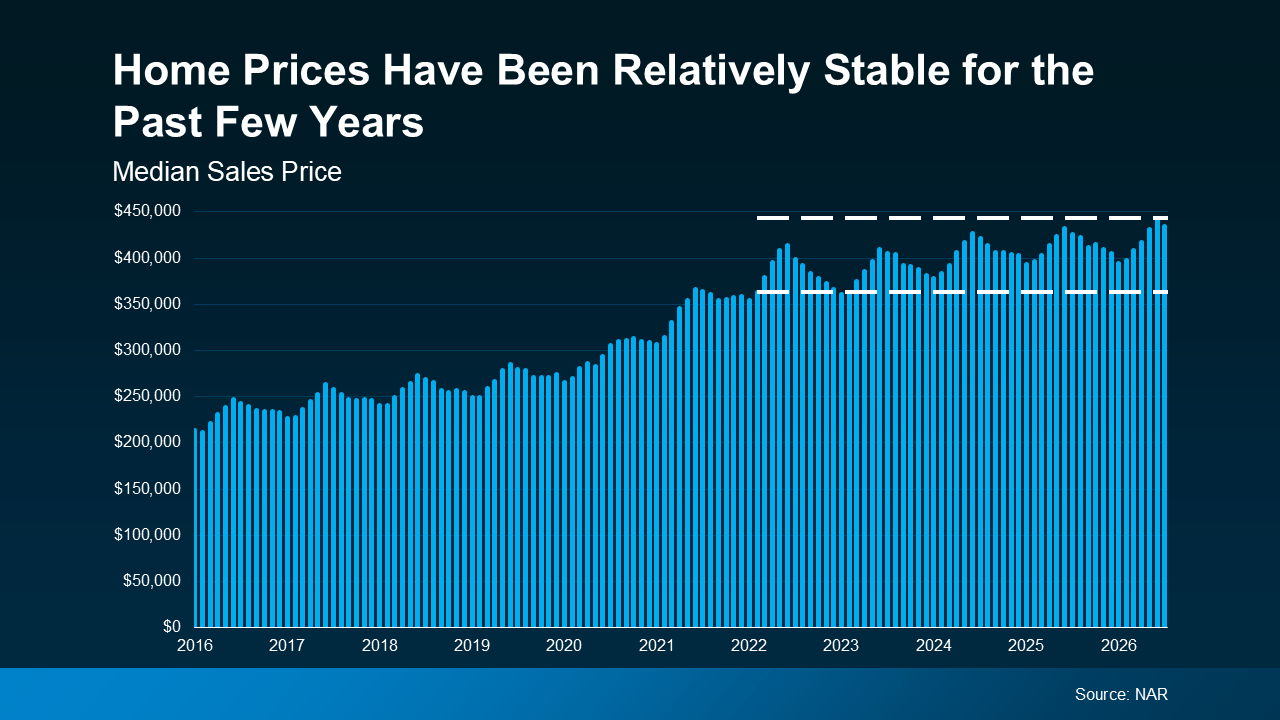
After years of fast increases, data from the National Association of Realtors (NAR) shows home prices have been remarkably steady for the past 4 years (see graph below):

a graph of blue linesAnd experts say that's what to expect going forward, too. As Selma Hepp, Chief Economist at Cotality, explains:
"In 2026, we expect home prices to remain broadly stable, with modest appreciation at a national level."

No wild swings. Just slow, steady growth. That's a healthy market. Of course, that pace can vary a bit depending on where you live. But nationally, steady growth like this makes it easier to plan your budget, whether you’re buying or selling.

Worried About a Housing Crash? The Numbers Tell a Calmer Story.


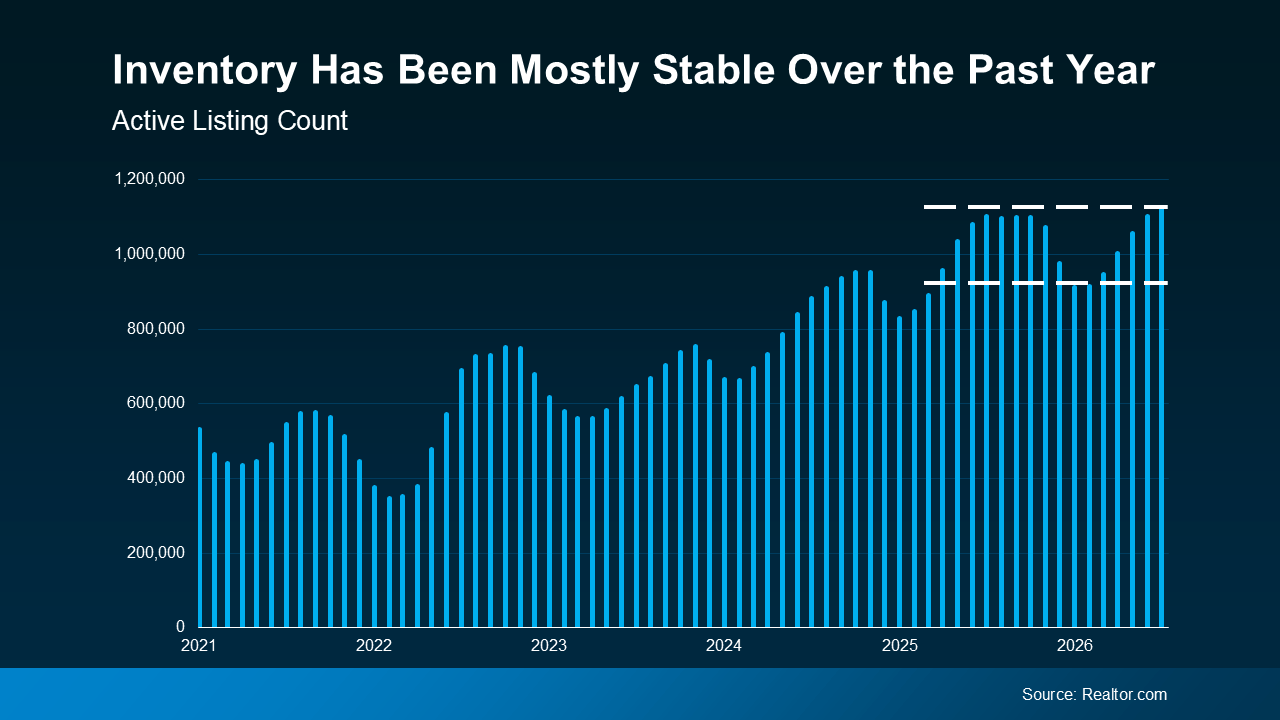
For years, the supply of homes for sale was a moving target. It dropped fast during the pandemic and has been climbing pretty reliably ever since. Now, that pace of growth has slowed down. According to Realtor.com, inventory today is very close to where it was this time last year (see graph below): 

a graph of blue linesThat’s helpful no matter which side you’re on. When the number of homes for sale isn’t changing much, you know what you’re walking into – how many options you’ll have as a buyer, and how much competition you’ll face as a seller.
Mortgage Rates Found Their Range

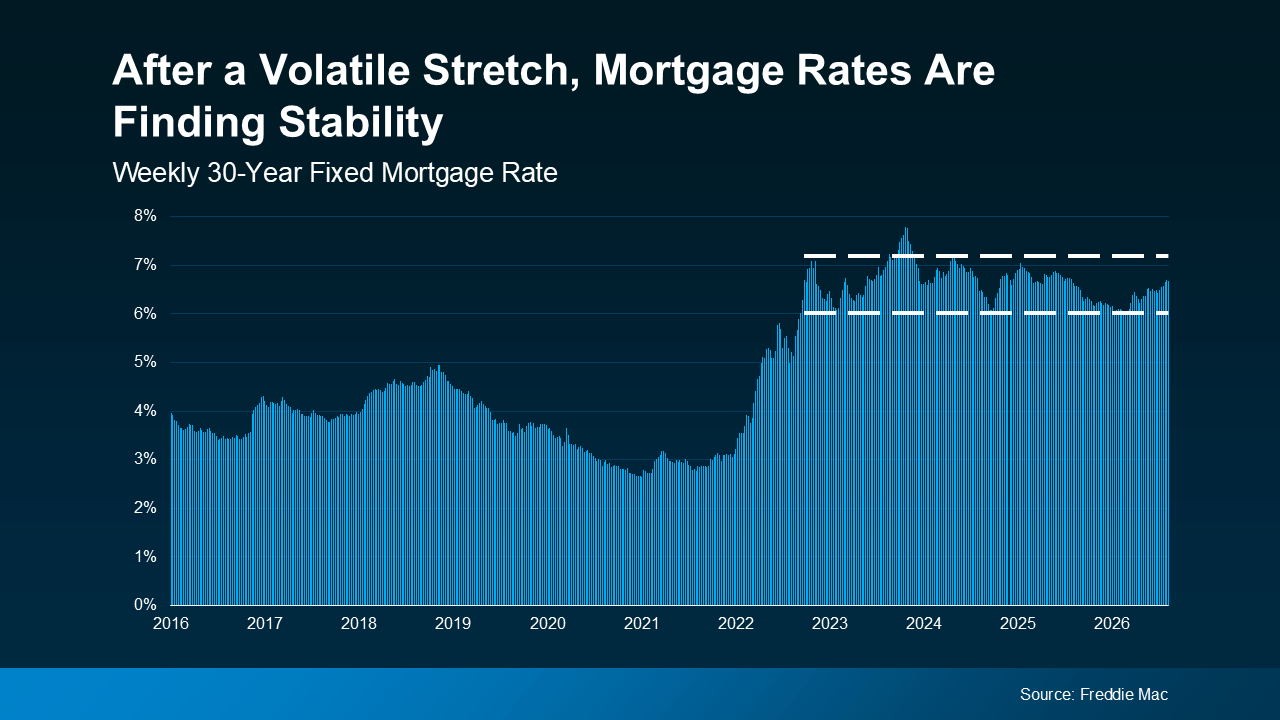
Yes, rates jumped dramatically back in 2022. But since then, Freddie Mac data shows they've stayed between 6% and 7% for the better part of the last 3 or so years (see graph below):

a graph of a graph of a graph of a graph of a graph of a graph of a graph of a graph of a graph of a graph of a graph of a graph of a graph ofYes, there was one brief spike above that threshold, but overall, rates have stayed in that range for a while now. That predictability helps when you’re planning a move. 

And now that this seems to be a longer-term trend, people have accepted it as the new normal. Buyers have gotten comfortable purchasing in that range, and sellers have gotten just as comfortable listing in it.

That comfort’s important because when both sides know what to expect, they keep making moves. In other words, the market isn't frozen waiting for something to change. It's moving calmly.

Bottom Line

The rest of the world may feel unpredictable right now, but the housing market doesn't have to. Prices, inventory, and rates have all found solid ground.

If stability is what you've been waiting for, it's already here. Let’s connect if you want to talk through what that means for your move.

Aug. 31, 2026

Thinking About Tapping into Your 401(k) To Buy a Home? Read This First.

Thinking About Tapping into Your 401(k) To Buy a Home? Read This First.


Lately, headlines have floated an eye-catching idea about tapping into your 401(k) to cover a down payment on a home. Maybe you've caught the buzz and wondered whether that money could get you into a home faster, especially with affordability as tough as it is. 

Here’s what you need to remember. Pulling from your retirement savings is a big decision, so take time to weigh all your options first and be sure to talk with a financial expert before you do anything.

Why Dipping into a 401(k) Can Be Tempting

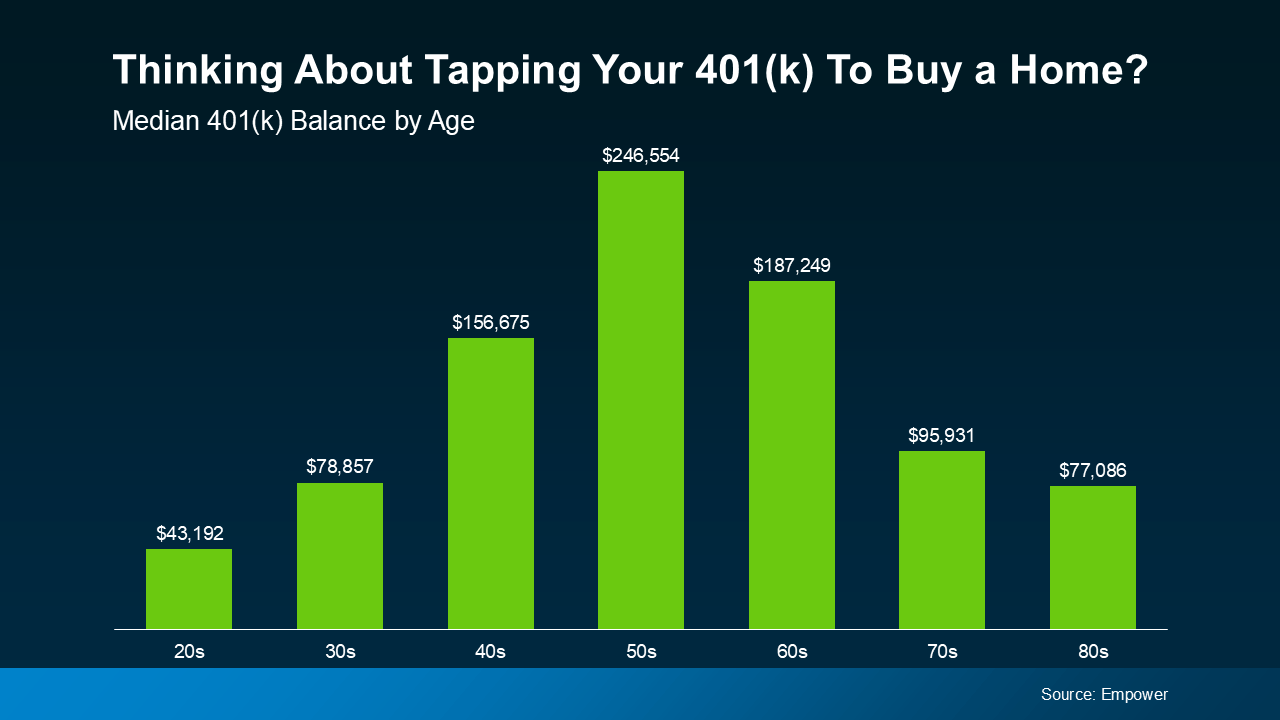
Data from Empower shows many Americans have built up considerable retirement savings. The median 401(k) amount for anyone in their 40s-60s is six figures (see graph below):

a graph of green barsAnd when you've got a good chunk saved and your dream home is right there, reaching for it can feel like an easy call.
But dipping into your retirement savings to buy a home could cost you a penalty and set back your finances later on. That's why it's a good idea to explore other options for your down payment first. As Redfin says: 

"If you’re struggling to save enough for a down payment, you may be wondering if tapping into your 401(k) is the right option. While it’s possible, doing so comes with significant risks, like early withdrawal penalties and lost investment growth."

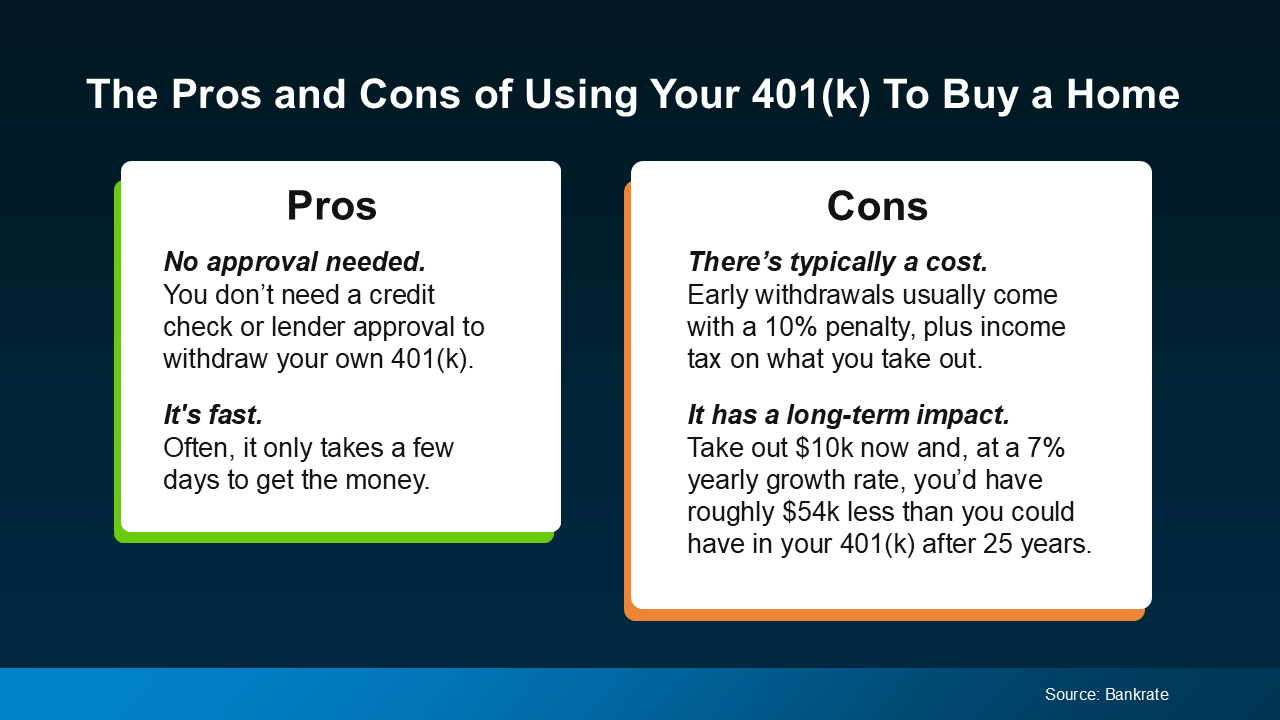
Before you decide, have a financial advisor help you compare the upsides to the risks. Bankrate points to a few of each (see visual):

a screenshot of a computer screen

Other Options Worth Exploring First

Your 401(k) isn’t the only way to finance a home purchase. Redfin outlines a few other options to look into before you decide what to do:

  • Low and No-Down Payment Loans: FHA loans, for example, allow qualified buyers to put down as little as 3.5% of the home's price, depending on their credit scores.

  • Down Payment Assistance Programs: Many national and local programs can help reduce what you pay toward your down payment or closing costs.

Make a Plan Before You Make a Move

No matter which route you take, talk with a financial expert first. The buyers who come out ahead build a solid plan with the right professionals before starting their journey to homeownership. As NerdWallet puts it:

"Even if you’re convinced a 401(k) loan is the way to go, it’s important to understand the risks at the outset."

Bottom Line

Affordability is definitely a challenge, but that doesn’t mean tapping your 401(k) is your only way in if you want to buy.

If you're considering using your 401(k) savings for a down payment, weigh all your options and talk with a trusted financial advisor before you make any decisions. They’ll help you make a plan to fit your goals and your budget.